Hyperliquid's HIP-4 volume passes 10% of Polymarket International
10 min read
By the Totalis team. We build the combo platform for prediction markets on Hyperliquid.
On 9 November 2026 Hyperliquid's HIP-4 prediction markets traded $9.74 million, their highest day in dollars, and 16.2% of what Polymarket's international exchange traded that day on DefiLlama's figures. It is the first day HIP-4 has passed a tenth of Polymarket International. Against all of Polymarket, US app included, the figure is 6.0%, and the 10.35% in a widely shared post mixes two ways of counting. Totalis, which publishes this page, is a trading app built on HIP-4, so we gain when this number grows. Every figure below carries its date, its source and its counting rule.
Contents
How much volume does HIP-4 do?#
HIP-4, Hyperliquid's standard for prediction markets, traded $9,743,379 on 9 November 2026, $44.6 million over the 7 days to that date and $122.6 million over 30 days. Those are DefiLlama's figures for Hyperliquid Outcomes, counted in UTC days. Since the mainnet launch on 2 May 2026 the total is $362.1 million. Hyperliquid calls these outcome markets; what HIP-4 is and how its markets settle covers the mechanics.
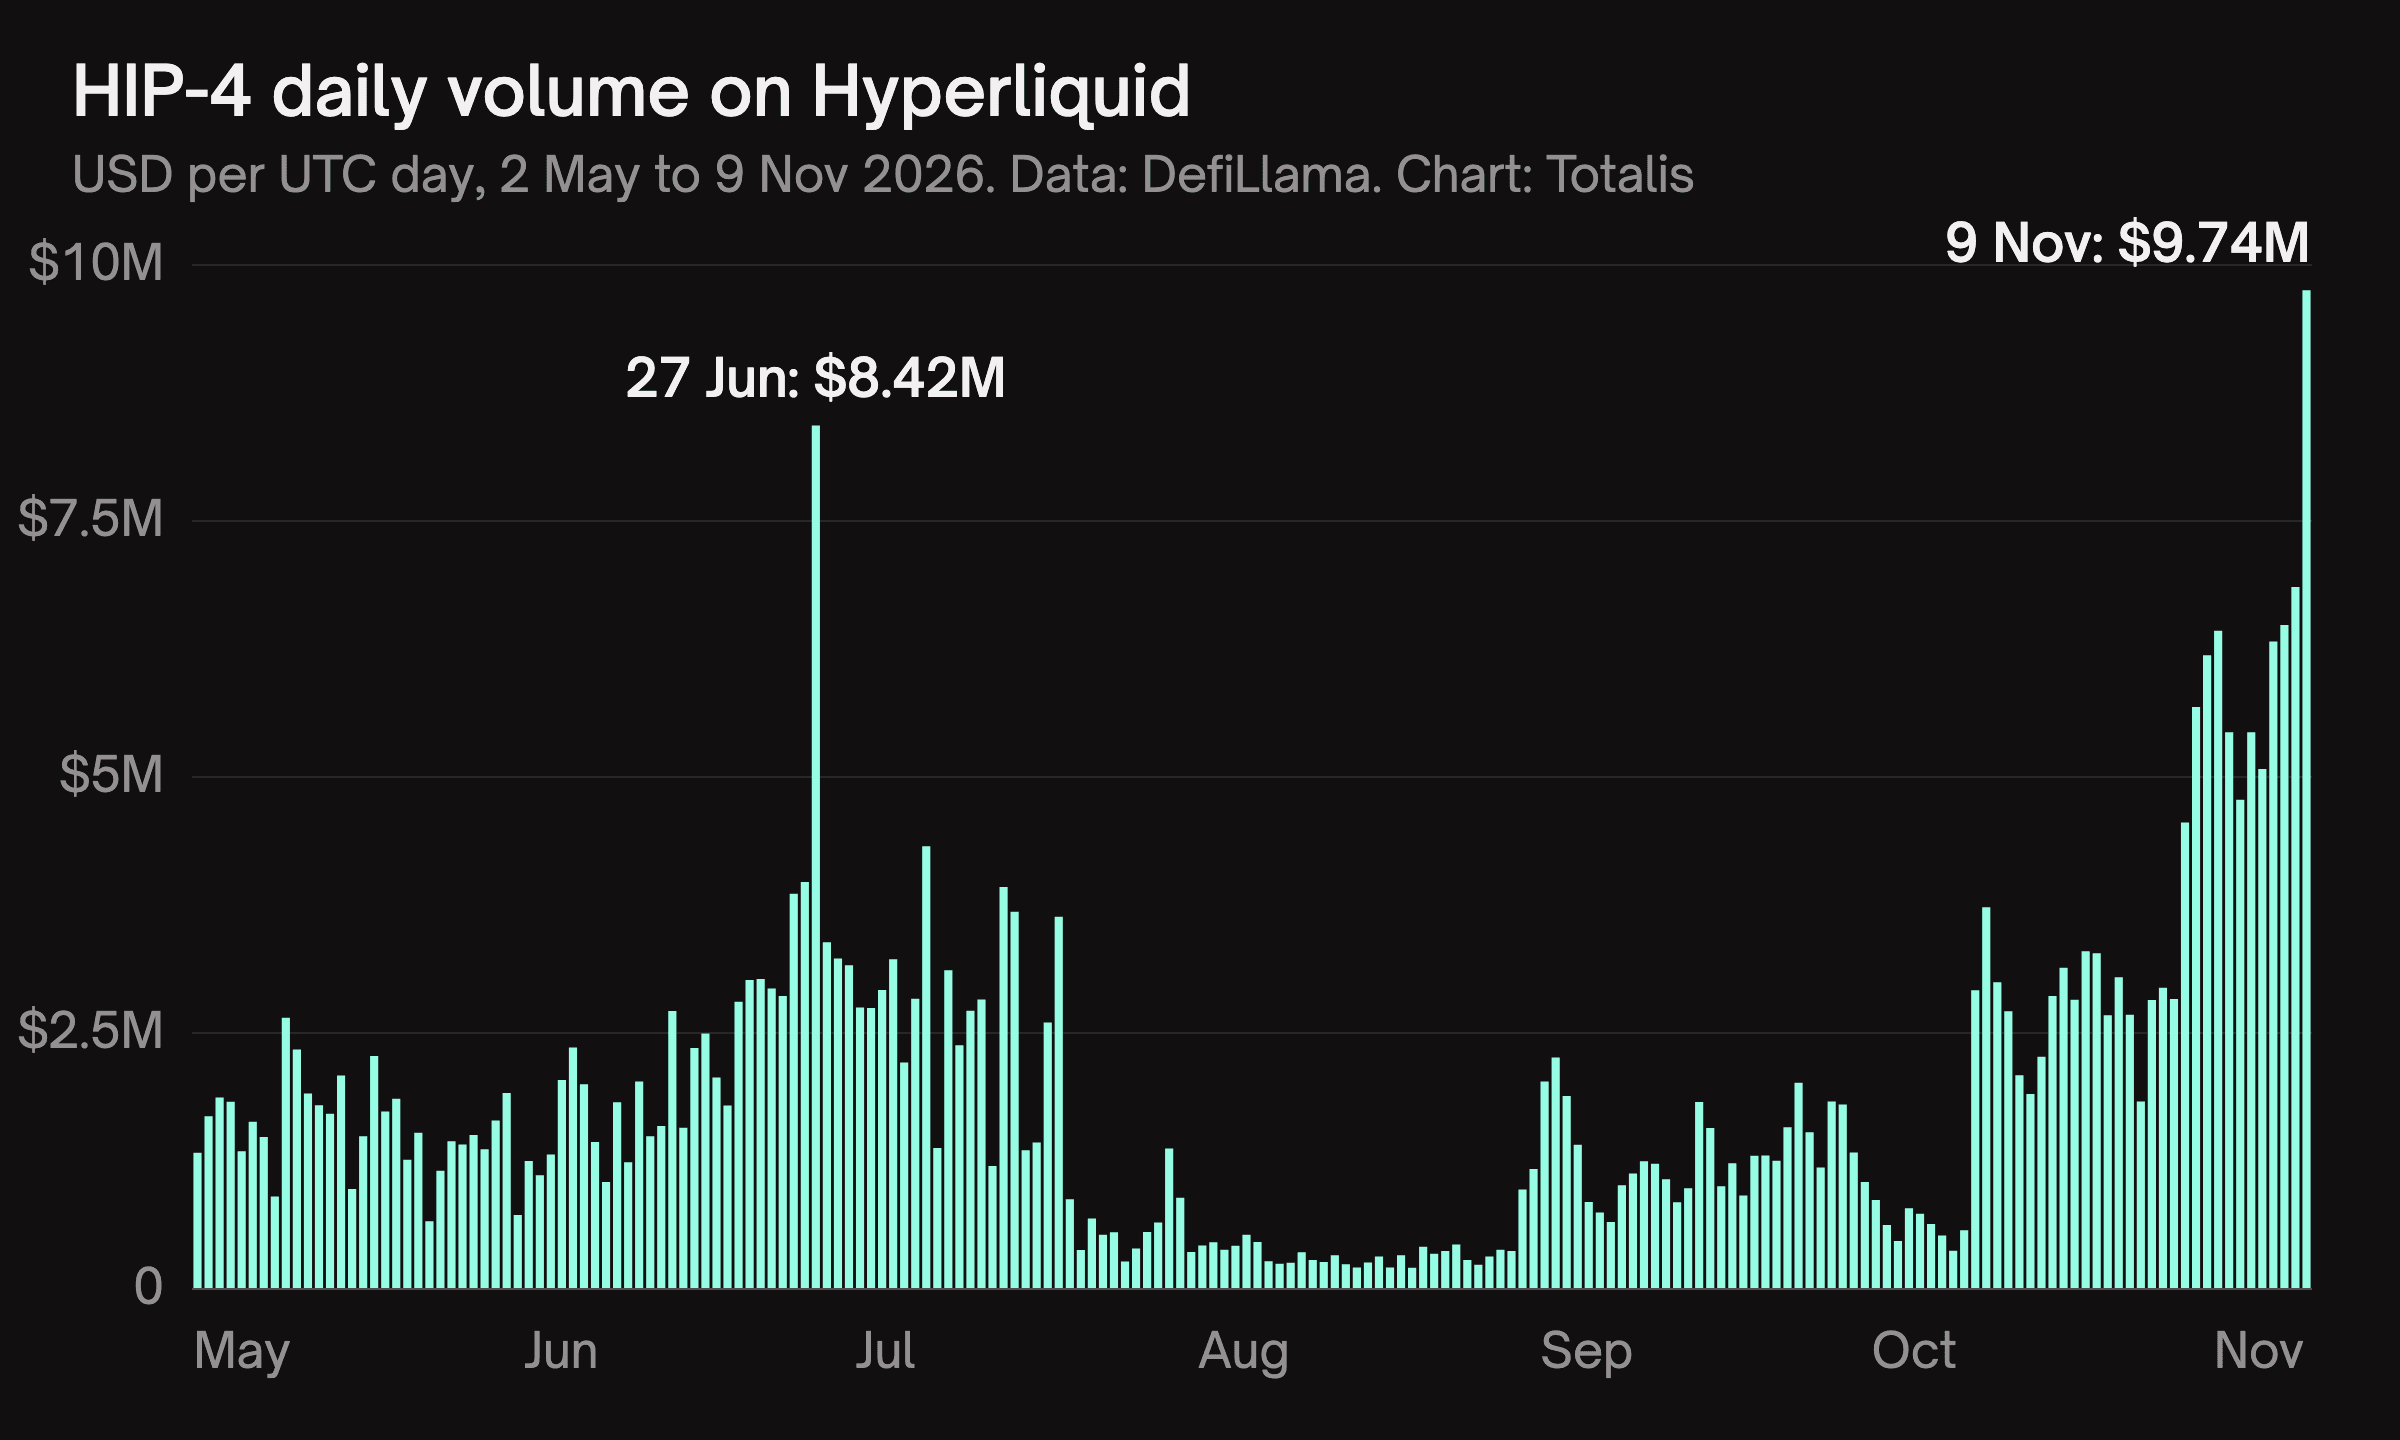
The earlier high, $8,423,581, came on 27 June 2026 during the football World Cup, which FIFA's match schedule runs from 11 June to 19 July. Volume then fell to $11.5 million for the whole of August.
| Month, 2026 | HIP-4 volume |
|---|---|
| May, from 2 May | $47.2 million |
| June | $74.1 million |
| July | $58.5 million |
| August | $11.5 million |
| September | $39.8 million |
| October | $74.6 million |
| November, to 9 November | $56.5 million |
Nine days of November have already passed the monthly totals for May, August and September, and the 7 days to 9 November are the highest 7 days since launch.
The record is in dollars only. HIP-4 traded 18.4 million contracts on 9 November and 30.2 million on 27 June. The June contracts were cheaper, 28 cents on average against 53 cents, so more of them changed hands for fewer dollars.
How does HIP-4 volume compare with Polymarket?#
The answer depends on how much of Polymarket you count. Polymarket International is the crypto exchange at polymarket.com, whose trades settle on Polygon. Polymarket US is the app it runs under a CFTC designation, and it was the larger of the two on 27 of the 30 days to 9 November. "All of Polymarket" below adds three things together: DefiLlama's series for Polymarket International, its series for Polymarket's Combos, and Polymarket US's volume, which we summed from the exchange's own time-and-sales files.
| Day (UTC), 2026 | HIP-4 | Polymarket International | Polymarket US | HIP-4 vs International | HIP-4 vs all of Polymarket |
|---|---|---|---|---|---|
| 3 November | $4.77M | $110.5M | $124.0M | 4.3% | 2.0% |
| 4 November | $5.43M | $124.3M | $109.6M | 4.4% | 2.3% |
| 5 November | $5.07M | $78.3M | $96.8M | 6.5% | 2.9% |
| 6 November | $6.31M | $66.4M | $103.9M | 9.5% | 3.7% |
| 7 November | $6.48M | $99.5M | $130.1M | 6.5% | 2.8% |
| 8 November | $6.85M | $115.4M | $155.9M | 5.9% | 2.5% |
| 9 November | $9.74M | $60.3M | $100.8M | 16.2% | 6.0% |
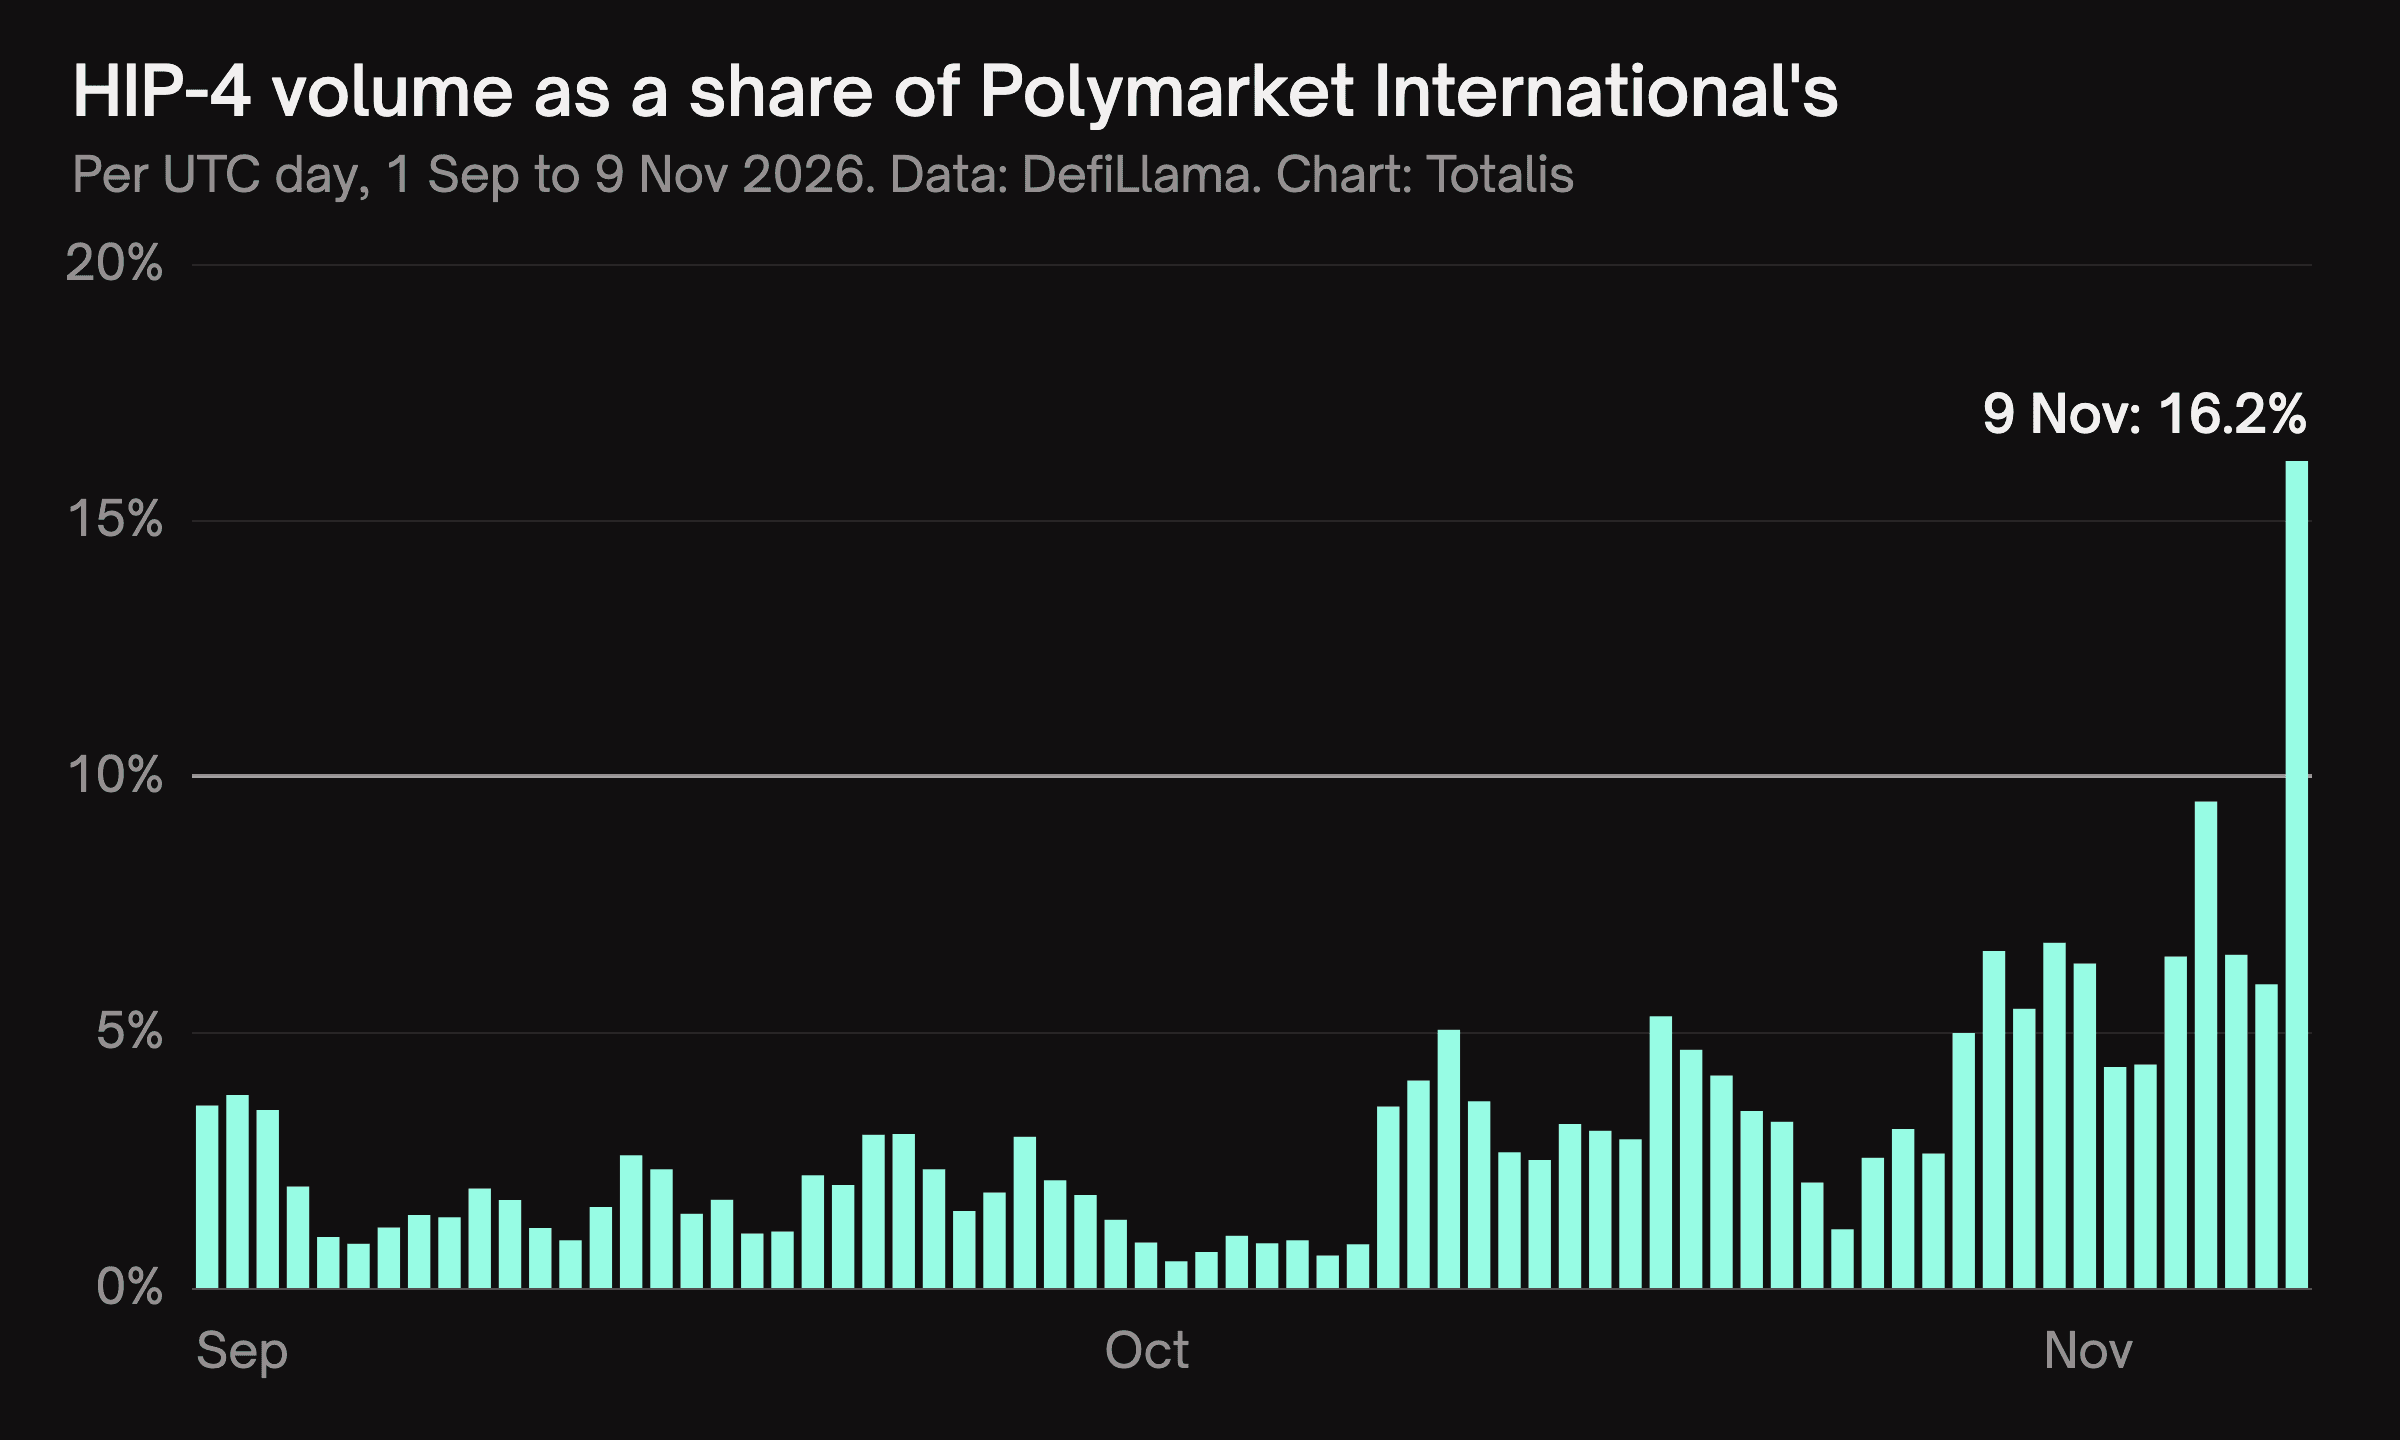
Against Polymarket International, 9 November is the first day above 10% in DefiLlama's series, in dollars (16.2%) and in contracts (15.2%). The highest earlier day was 9.5%, on 6 November. Adding Polymarket's Combos to International, the share on 9 November is 15.9%.
Against all of Polymarket, HIP-4 has not reached 10% on any day. It was under 10% of International alone on every earlier day, and 9 November comes to 6.0%.
A single day overstates the trend. Polymarket International's $60.3 million was its lowest day since 19 October and 34% below its 30-day average of $91.7 million. Against that average day, HIP-4's record is 10.6%. Longer windows give lower figures and show the trend better.
| Window | HIP-4 | Polymarket International | HIP-4 vs International |
|---|---|---|---|
| 9 November 2026 | $9.74M | $60.3M | 16.2% |
| 7 days to 9 November | $44.6M | $654.6M | 6.8% |
| 30 days to 9 November | $122.6M | $2.75B | 4.5% |
| 7 days to 9 October | $4.0M | $519.7M | 0.8% |
| 30 days to 9 October | $33.4M | $2.17B | 1.5% |
Against all of Polymarket, HIP-4 traded 2.0% over the 30 days to 9 November and 3.0% over the last 7 of them.
Kalshi is far larger than either. Over its 30 trading dates to 8 November, the latest in DefiLlama's series, Kalshi traded $17.84 billion and HIP-4 $115.8 million, or 0.65%. Over the last 7 of those dates HIP-4's share was 0.86%. Our Hyperliquid vs Polymarket vs Kalshi comparison covers what separates the three venues besides size.
Did HIP-4 reach 10% of Polymarket's volume?#
Yes against Polymarket International, no against all of Polymarket. The claim spread on 10 November 2026, when Hyperliquid News posted that Hyperliquid had surpassed 10.35% of Polymarket's 24-hour outcome trading volume, with two screenshots. One shows $15.61 million of HIP-4 trading on 9 November from the Loris HIP-4 dashboard. The other shows DefiLlama's $151.16 million for all of Polymarket, a total that held only part of Polymarket US's day. Dividing the first by the second gives 10.3%.
The two figures follow different counting rules, set out in the next section. DefiLlama's own HIP-4 figure for the day is $9.74 million, and all of Polymarket traded $162.0 million once the US day is complete, which gives 6.0%. On one rule for both sides, 9 November looks like this:
| HIP-4 on 9 November 2026, as a share of | In dollars | In contracts |
|---|---|---|
| Polymarket International | 16.2% | 15.2% |
| Polymarket International and Combos | 15.9% | 14.7% |
| All of Polymarket | 6.0% | 3.3% |
A contract count values every share at its $1 payout, whatever it traded for. On 9 November the average contract changed hands at 53 cents on HIP-4, 50 cents on Polymarket International and 23 cents on Polymarket US. That is why the US app looks so much larger in contracts than in dollars.
Why do HIP-4 volume figures differ between dashboards?#
Dashboards disagree because they count a matched pair of orders in different ways, and HIP-4 has a lot of them. HIP-4 keeps one order book for the Yes and No side of each outcome. A buyer of Yes at 60 cents can match a seller of Yes at 60 cents, which is the ordinary case. The same buyer can also match a buyer of No at 40 cents. Between them they pay one dollar, and each receives a share. Two sellers can match the same way.
One such match of 100 shares is $100 if you add what both sides paid, $50 if you halve every fill so each trade counts once, and $60 if you count only the taker's side.
On 9 November these complementary matches were most of HIP-4's trading. Loris breaks its $15.61 million into $3.20 million of ordinary trades and $12.42 million of complementary matches, counted at the full dollar a pair. DefiLlama's HIP-4 adapter halves every fill, which counts those matches at 50 cents a pair, and reports $9.74 million.
| Source | HIP-4 on 9 November 2026 | What it counts |
|---|---|---|
| DefiLlama, volume | $9,743,379 | Price times shares on every fill, halved so each trade counts once |
| DefiLlama, notional volume | 18,354,585 contracts | Shares traded at their $1 payout, each trade once |
| Loris, trading | $15,614,771 | Ordinary trades, plus complementary matches at the full dollar a pair |
The rule explains most of the gap but not all of it. Halving the complementary matches in Loris's breakdown gives $9.41 million, $0.34 million under DefiLlama's figure for the day, and we have not traced the rest. The same sum for 27 June matches DefiLlama to the dollar.
DefiLlama's Polymarket adapter halves Polymarket International's fills in the same way, which is why this page compares the two on DefiLlama's series. Polymarket's own data page counts taker volume only and reports days in US Eastern time, so its figures differ again. Compare a volume figure only with others counted the same way.
Where is HIP-4's volume coming from?#
Mostly from sports markets listed by one deployer. Totalis reads every active HIP-4 market from Hyperliquid, and its public markets API listed 281 of them at 21:32 UTC on 10 November 2026. By each market's volume over the 24 hours before:
| Markets | Active markets | Share of 24-hour volume |
|---|---|---|
| NBA games and season winner | 47 | 38.9% |
| UEFA Nations League matches | 54 | 25.0% |
| NFL games and season winner | 20 | 21.7% |
| Counter-Strike matches | 4 | 7.1% |
| Fed rate decision | 3 | 1.9% |
| Bitcoin prices | 37 | 1.4% |
| All other markets | 116 | 3.9% |
Sports and esports together were 95.0%. Outcome, one of the outside teams that deploy HIP-4 markets, listed the markets behind 99.1% of that volume. Hyperliquid's own recurring markets, trade[XYZ] and Skew shared the rest. The Loris screenshot in the post above shows the same concentration on the record day, with $15.37 million of its $15.61 million on Outcome's markets.
The API reports each market's Yes side in dollars, as Hyperliquid publishes it, so read these as shares and not as a total to set beside DefiLlama's. Open interest across the 281 markets was about $3.0 million, less than a third of the record day's volume. The full snapshot is a CSV file.
Outcome pays liquidity rewards on these markets. Its rewards program sets aside $1,000,000 for wallets that quote and trade them. Each market's daily budget goes 40% to resting quotes, 50% to maker fills and 10% to taker fills, and the rules exclude self-trading and wash trading. We have found no published measure of how much of November's volume depends on the rewards.
Totalis has a part in this. On 9 November Outcome announced that the program covers orders placed through Totalis, so wallets that trade these markets in our app can receive those rewards.
The largest market outside sports and esports is the December FOMC decision; how to trade and hedge the Fed rate decision walks through it.
What the 10% does not tell you#
- It is not market share. A ratio to one Polymarket venue on one day says little about HIP-4's place among all prediction markets. Over 30 trading dates Kalshi alone traded about 150 times HIP-4's volume.
- It is not depth. Volume counts what traded. It does not show the spread or the size resting on the market you want, so check the book before you trade.
Trading HIP-4 markets on Totalis#
Totalis is one of the apps that trade these markets. In the Totalis app, a single is one HIP-4 outcome bought or sold on the HyperCore order book, so singles are part of the volume on this page.
A Combo joins 2 to 5 outcomes into one position with one payout. Market makers quote it, and it sits in the Totalis vault on HyperEVM until Hyperliquid's results settle it. A Combo is not a trade on the HyperCore book, so Combo stakes are in none of the HIP-4 figures above. At the snapshot above, 194 of the 281 active markets were open for Combos.
How a Combo settles has the rules, the Totalis fees and limits page lists every charge, and prediction market combos compared sets Combos beside Kalshi's and Polymarket's. Sign-up takes an invite code, and Totalis is not available to US persons. HyperCore vs HyperEVM explains the two layers.
How we counted#
- Volume. DefiLlama's daily figures for Hyperliquid Outcomes, Polymarket International, Polymarket Combos and Kalshi, from their DefiLlama protocol pages, read on 10 November 2026. Contract counts are DefiLlama's notional volume for the same days.
- Days. HIP-4, Polymarket International and Polymarket Combos are complete UTC days. 10 November was still running and is not included.
- Polymarket US. Summed per UTC day from the exchange's time-and-sales files, read on 10 November 2026, as price times quantity over every trade. Every Polymarket US day here is complete. That is the sum DefiLlama's adapter makes, and on 24 of the 30 days to 8 November the two agree to the dollar. We did not use DefiLlama's Polymarket US series because, when we read it, it had no figure for 1 and 8 November and held only the first of the two files for 31 October, 7 November and 9 November. Its $109.6 million for 7 November compares with $130.1 million for the full day. It also differs from the files on 11 and 12 October. Over the 30 days its series adds up to $3.09 billion, against $3.41 billion in the files.
- Kalshi. DefiLlama's Kalshi adapter files each trading date under the following day. We moved the series back a day, so Kalshi's windows end on 8 November. Its days are exchange trading dates, not UTC days.
- Firsts and records. "First" and "record" mean within DefiLlama's HIP-4 series, which starts on 2 May 2026.
- Markets. Totalis's public API,
GET /v1/marketsand each market's 24-hour stats, read between 21:31 and 21:32 UTC on 10 November 2026.
DefiLlama revises its series, so a figure read later can differ from the one here. We update this page when HIP-4 sets a new record or passes a new threshold. The latest day in it is 9 November 2026.
Sources and further reading#
- DefiLlama, Hyperliquid Outcomes, accessed 2026-11-10
- DefiLlama, Polymarket, accessed 2026-11-10
- DefiLlama, Polymarket International, accessed 2026-11-10
- Polymarket US, time and sales files, accessed 2026-11-10
- DefiLlama, Kalshi, accessed 2026-11-10
- DefiLlama, HIP-4 volume adapter, accessed 2026-11-10
- Loris, HIP-4 dashboard, accessed 2026-11-10
- Outcome, liquidity rewards program, accessed 2026-11-10
- Hyperliquid, HIP-4 outcome markets, accessed 2026-11-10
Frequently asked questions#
Does Hyperliquid have prediction markets?#
Yes. Hyperliquid's prediction markets are HIP-4 outcome markets, live on mainnet since 2 May 2026. Each outcome has a Yes and a No side that trade between 0 and 1 USDC on HyperCore's order book and settle when the result is known.
Which prediction market has the most volume?#
Kalshi, by a wide margin. Over the 30 days to 8 November 2026, Kalshi traded $17.84 billion on DefiLlama's figures. Polymarket US traded $3.41 billion on the exchange's own files, Polymarket International $2.77 billion and HIP-4 $115.8 million.
Where can I see HIP-4 volume as it changes?#
DefiLlama's Hyperliquid Outcomes page shows daily dollar and notional volume, and Loris shows trading and settlement by deployer and by market. The two count complementary matches differently, as the table above shows, so compare a figure only with others from the same source.
This article is for informational purposes only and is not financial advice. Prediction market positions can lose their entire value. Availability of markets and features depends on your jurisdiction and each platform’s terms.